Chapter 91A — People analytics
The board asks three questions every quarter: how many people do we have, how many are leaving, and are the ones who stay turning up. An auditor asks what the untaken leave is worth and whether the overtime bill is under control. A recruiter asks how long a hire takes. Every answer is in the records the earlier chapters built; this chapter is the page that measures them, with what each figure counts, so the number you read out is the number the record supports.
What this chapter covers
- 91A.1 The window and the cut
- 91A.2 Headcount, movements and attrition
- 91A.3 Absenteeism and the Bradford factor
- 91A.4 Overtime, leave liability and schedule coverage
- 91A.5 Hiring and goals
- 91A.6 Pivots and saved views
The concept
A metric is a record counted a declared way over a declared period. Headcount is the people employed on a day. Attrition is leavers over the average headcount of the period, so a quarter's 10% is not a year's; annualising scales it to twelve months. Regretted attrition is the part the company did not want. Absenteeism is unplanned absence over scheduled working days; the Bradford factor weights it by how often it happens, because ten single days disrupt more than one fortnight. Leave liability is what the balances would cost if paid out today. Time to hire runs from application to hire; offer acceptance is accepted over decided. A metric is only as good as its definition, so each is written on the page.
How Operentra handles it
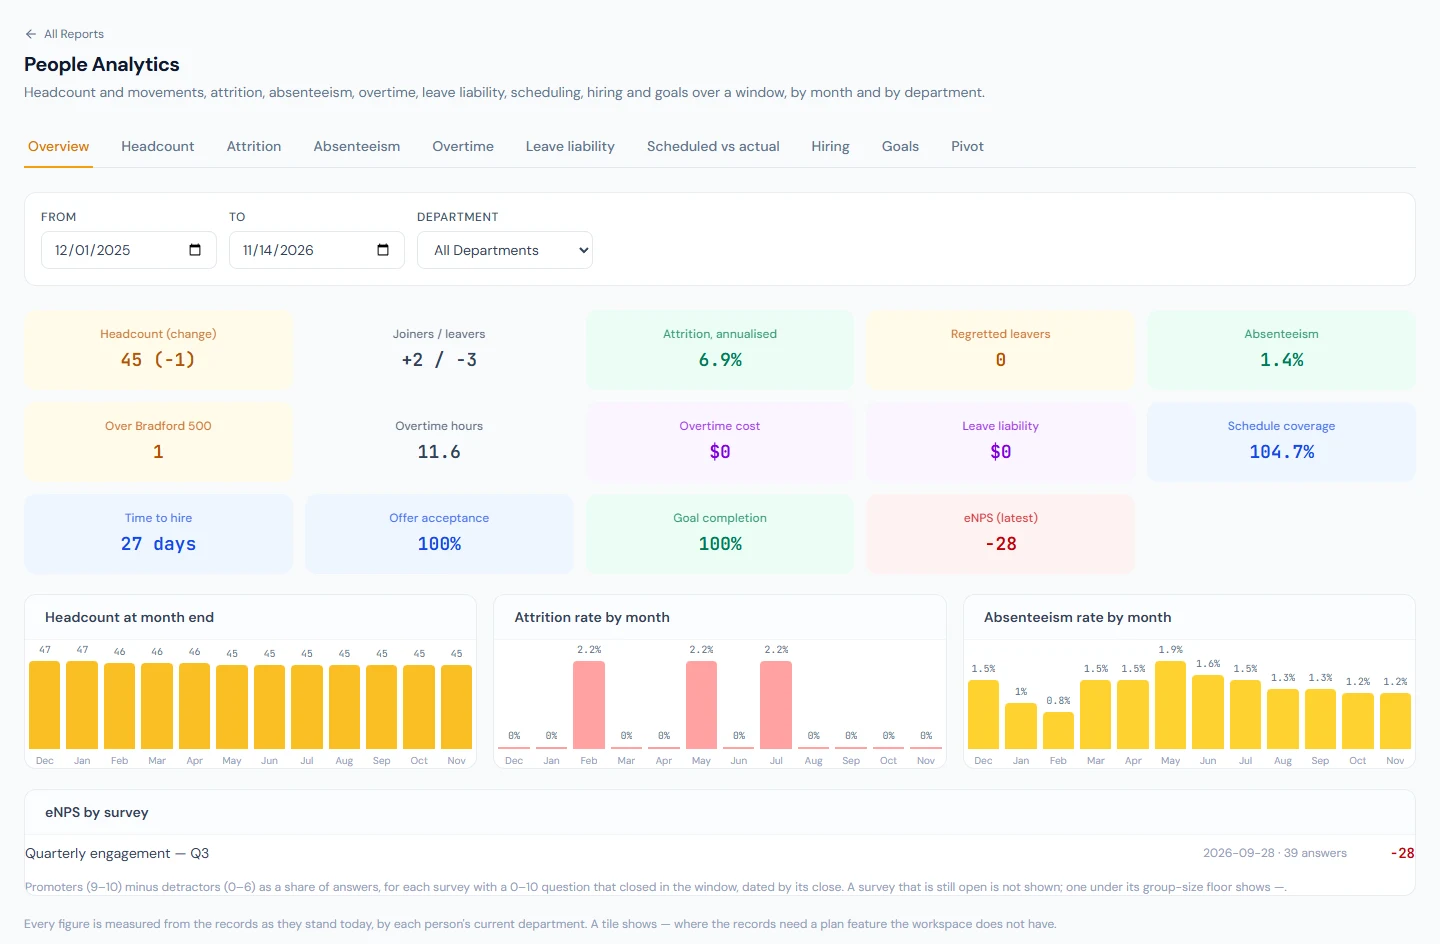
- Reports › People Analytics takes a window (two years at most) and an optional department, and shows an Overview of tiles, then a tab per figure with its tiles, a monthly series, a department table and Export CSV.
- Headcount counts people employed at each month end from their joining date to the separation that stands; Attrition divides the leavers by the average headcount and counts the separations marked Regretted leaver.
- Absenteeism reads the same resolved days as Daily Attendance and the Bradford factor per person; Overtime reads attendance hours and payroll cost; Leave liability reads the nightly snapshot; Scheduled vs actual reads the roster against attendance.
- Hiring needs Recruitment and Goals needs Performance; the Pivot needs the People analytics plan feature (Enterprise plan).
- Who:
reports.all(Super Admin, HR Manager, Accountant).
Walkthrough
Northwind's HR Manager opens People Analytics for the last twelve months before the board meeting, reads the overview, opens Attrition to see which department the leavers came from and how many were regretted, exports the Bradford table for the operations lead, and saves a pivot of leavers by designation by month for next quarter.
91A.1 The window and the cut
The From and To dates are the window; every figure is measured inside it and cut into calendar months, the first and last clipped to the dates. Department narrows to the people whose current department it is, which is also how the department tables group: a transfer in May counts in the new department for the whole window. Every figure is measured from the records as they stand when the page loads; a corrected day or a cancelled separation changes the next read, so a number quoted to the board should be exported on the day.
91A.2 Headcount, movements and attrition
Headcount at a month end counts everyone whose employment covers that day: joined on or before it, and not separated before it. A rehire's earlier employment counts in its own months. Joiners and Leavers are the employments that started or ended in the month; the Net is the difference. Attrition divides the leavers by the average headcount, the mean of the headcount the day before the window and at its end, per month and over the window; Annualised scales the window's rate to twelve months, so a quarter at 5% reads 20%. Regretted counts the leavers whose separation was marked Regretted leaver on the offboarding form (Chapter 83), the flag HR sets when the company would have kept the person; By separation type splits resignations from terminations and the rest. A cancelled separation never happened and counts nowhere.
91A.3 Absenteeism and the Bradford factor
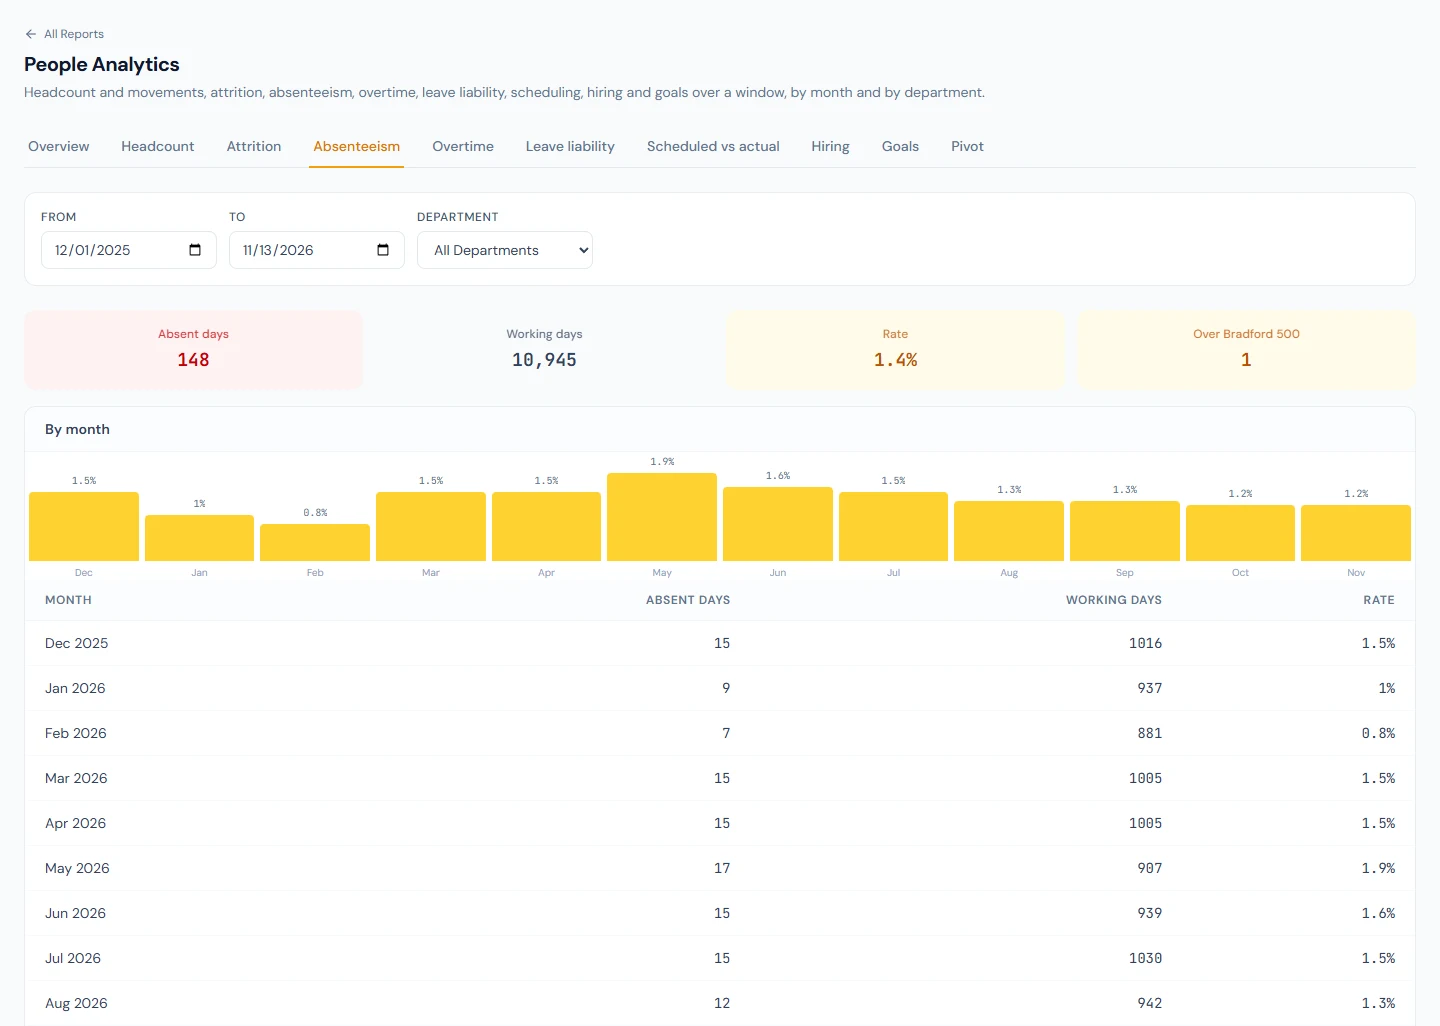
Absenteeism is absent days over scheduled working days, both read the way Daily Attendance shows them: a working day nobody marked is absent, a weekend, holiday or day on leave is not a working day, and days before someone joined or after they left are outside the count. The Bradford factor per person is S² × D: the number of absence spells squared, times the days absent. A run of absent working days is one spell, and a weekend inside it does not break it, so five Mondays score 5² × 5 = 125 while one five-day absence scores 1 × 5 = 5. The table lists everyone with an absence, highest first, and the overview counts the people at 500 or more, the usual point for a conversation; it is a prompt to look, not a verdict.
91A.4 Overtime, leave liability and schedule coverage
Overtime hours are the attendance module's credited overtime by the day's month; cost is the overtime pay on the payroll runs whose period ends in the window, so it appears once a month is processed and only on a plan with payroll. Leave liability at each month end is the total of the latest nightly snapshot on or before it (Chapter 47), and the latest snapshot by leave type; a workspace without snapshots shows nothing until Leave Reports › Liability takes one. Each month's row names the date of the snapshot it read: snapshots older than about two months are kept one per month, the month's last, so a closed month always reads its own. Scheduled vs actual sums the roster's scheduled hours (the default shift where nothing is rostered) against hours worked, with no-shows (a scheduled day that passed with nothing or an absence) and unscheduled hours worked off the roster; coverage is worked over scheduled.
91A.5 Hiring and goals
Hiring reads the applications hired in the window: days to hire from the application date to the hire date, as an average and a median; offers sent in the window, accepted and declined, and the acceptance rate as accepted over decided (a pending offer counts in neither). The department is the opening's. Goals reads the goals due or completed in the window: completion as completed over all, and open goals by their latest check-in's confidence. A goal its owner marked private is not counted. Both tabs show a lock when the plan lacks Recruitment or Performance.
91A.6 Pivots and saved views
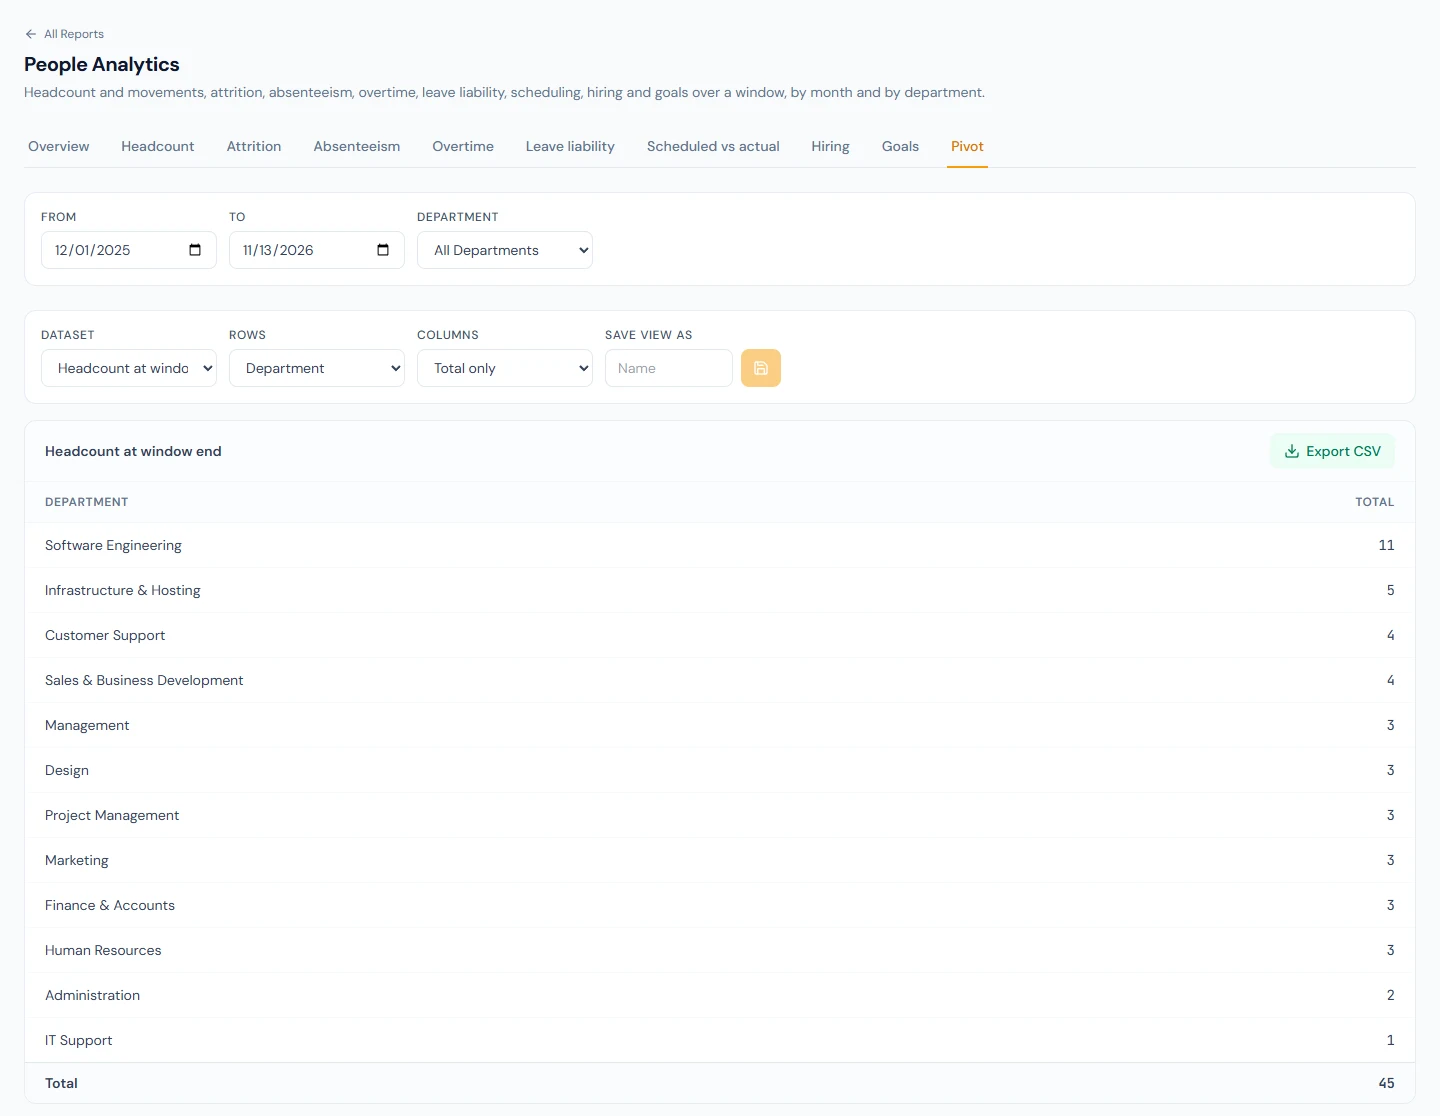
Pivot (with the People analytics plan feature) cuts one dataset by one dimension: headcount at the window's end, joiners, leavers, absent days, overtime hours or approved leave days, by department, designation, branch, employment type or gender, in total or with a column per month. Save view as keeps the cut under a name for you; the saved views sit above the table, one click to apply, with a bin to remove. Export CSV writes the table as shown.
What happens next
A figure that surprises you leads back to its records: a leaver to
Offboarding (Chapter 83), an absence to Daily Attendance
(Chapter 37), an overtime cost to the run
(Chapter 55). The API's reports:read scope serves the same
figures to a board pack built outside Operentra (Chapter 97).
What the employee sees
Nothing: People Analytics is HR's and finance's page. An employee's own absences and leave balance are in their portal as before.
Common mistakes
- Reading a quarter's attrition as a year's. The window's rate is over the window; quote the annualised figure, and say so.
- Forgetting the regretted flag. Regretted attrition counts only separations marked at the time; a figure of zero may mean nobody ticked the box.
- Comparing departments after a reorganisation. People count in their current department for the whole window.
- Treating the Bradford factor as a sanction. It ranks patterns of short absence for a conversation; the reasons are in the records.
- Quoting a liability without a snapshot. The trend shows the latest snapshot on or before each month end; take one before the meeting.
Practice
Use your own trial workspace, not a customer's.
- Open People Analytics for the last twelve months and read the overview; then narrow it to one department and watch the tiles move.
- Mark one recent separation as a regretted leaver and reload Attrition.
- Find the top Bradford factor, open that person's Daily Attendance, and count the spells yourself.
- Take a leave liability snapshot, then read the Leave liability tab.
- Build a pivot of absent days by designation by month, save it, and export it.
Quiz
1. How is the attrition rate measured, and why annualise it?
Leavers in the period over the average of the headcount at its start and its end. A short window's rate is scaled to twelve months so that it can be compared with a yearly figure.
2. Five single-day absences and one five-day absence: which has the higher Bradford factor?
Five single days: 5² × 5 = 125, against 1² × 5 = 5 for one spell of five days. The factor weights how often absence happens.
3. Where does the leave liability figure for March come from?
The latest nightly snapshot on or before 31 March, summed over the people in the window; without a snapshot the month shows nothing.